AI training data quality validation report
Issued by the Telecommunications Technology Association (TTA) / Report No. PDQ-2023-093-117
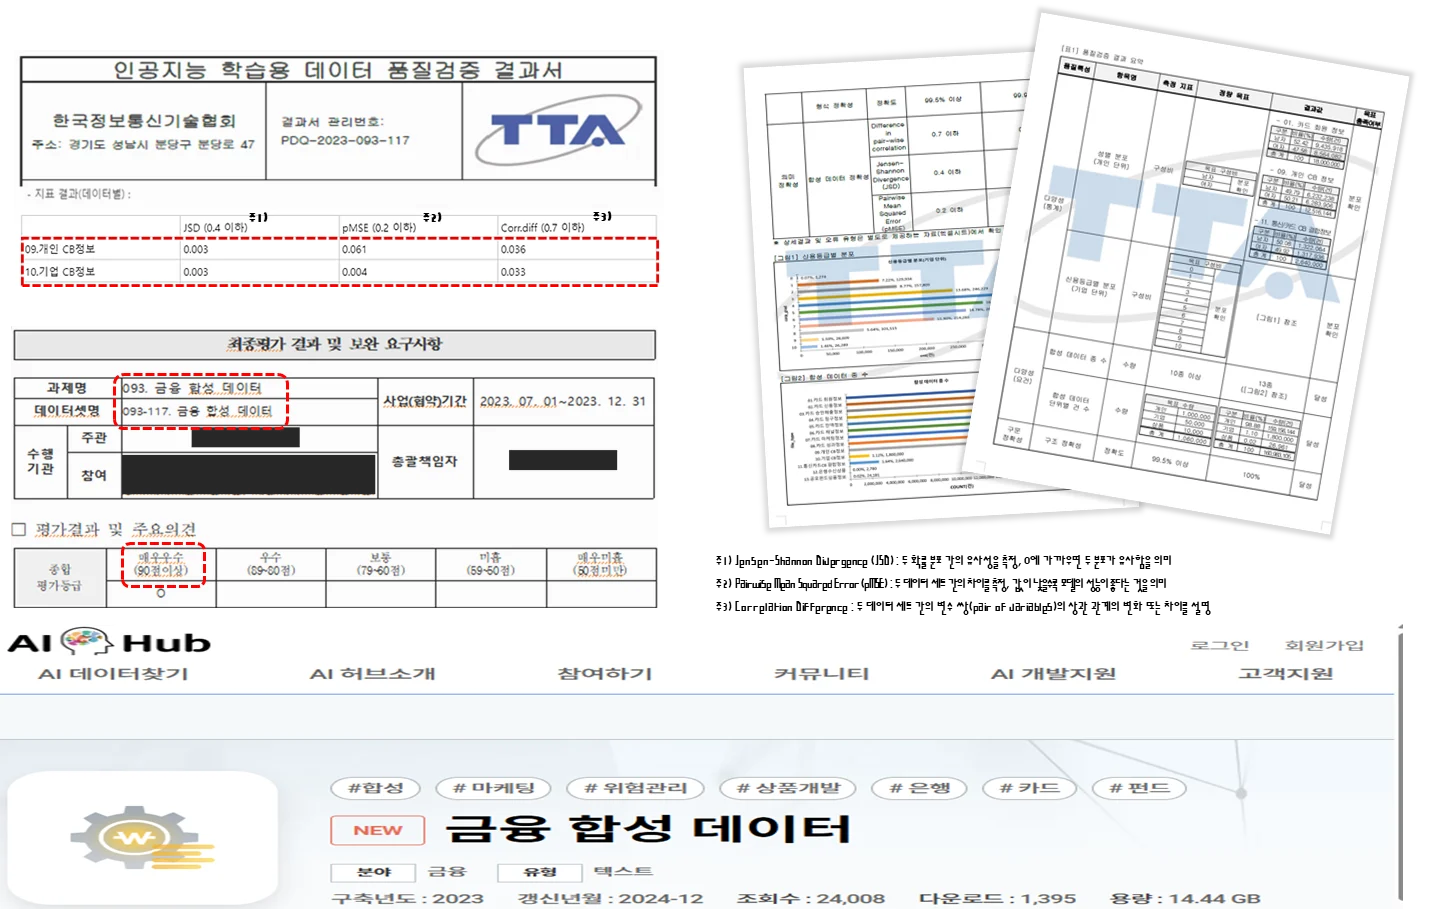
Financial synthetic data — "Very Excellent" grade
In the financial synthetic data quality validation conducted from July to December 2023, we exceeded the targets in every area — statistical accuracy, diversity, and structural accuracy. The result was published on AI Hub as "Financial Synthetic Data," freely available to everyone.
- Built in 2023, refreshed 2024-12 / Domain: finance, Type: text
- 24,008 views · 1,395 downloads · 14.44 GB (published on AI Hub)
- Both the 09. Personal CB and 10. Corporate CB datasets passed validation
- # synthetic # marketing # risk management # product development # banking # cards # funds
| Dataset | JSD (≤ 0.4) | pMSE (≤ 0.2) | Corr.diff (≤ 0.7) | Result |
|---|---|---|---|---|
| 09. Personal CB | 0.003 | 0.061 | 0.036 | ✓ Pass |
| 10. Corporate CB | 0.003 | 0.004 | 0.033 | ✓ Pass |
Note 1) Jensen-Shannon Divergence (JSD): measures the similarity between two probability distributions; values near 0 mean the distributions are alike
Note 2) Pairwise Mean Squared Error (pMSE): measures the difference between two datasets; lower values mean they are harder to distinguish
Note 3) Correlation Difference (Corr.diff): describes the change or difference in the correlations of variable pairs between two datasets